Jira Portfolio Management with Business Intelligence
Table of contents
Intention
An approach for portfolio management, and task alignment to strategic themes. Based on accumulated data from project management combined with business intelligence. Data re-structuring and aggregation (grouping) on individual levels like
- strategic themes
- capacities
- customers
- system components
- and more customized levels
Real time reporting with calculated error patterns for approximating forecasts.
Preamble
Business intelligence provides tools for data normalization, re-structuring of data for different stakeholder groups, and the visualization of essential indicators.
Recognized patterns from normalized historic project management data (data mining) will be used for algorithms producing forecasts for the next upcoming weeks, or, with data on a higher abstraction level, for the next upcoming quarters.
A normalized view on all related projects, independent of methodologies like Scrum or Kanban, and also independent of any kind of estimates like story points or time. A retrospective for traceability related to outcomes, and competitive forecasts for versatile stakeholder interests.
When turning a steering wheel five degrees to the right, a car will follow this movement accurately. The same expectations about portfolio management. If a top manager turns the “wheel” five degrees to the right, the entire company will get aligned to this strategic change.
Concept
This chapter is structured into
- Deployment – essential software
- Use Cases – roles and stakeholders
- Processes – Flow of opportunities
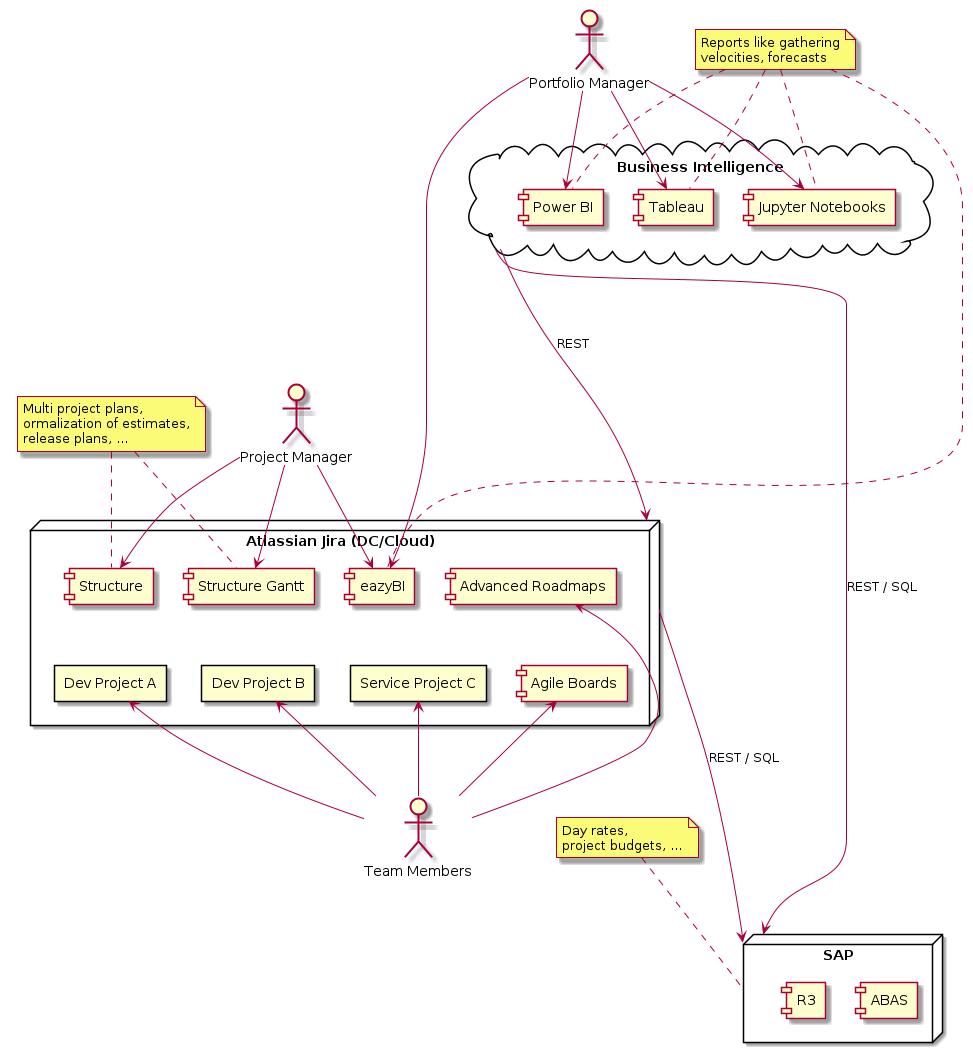
Deployment
Note that eazyBI for Jira actually is a full fledged business intelligence tool running on Jira. It brings the power for customized, sophisticated reports with drill in support for traversing related Jira data.
With eazyBI any kind of reports is rendered in Jira dashboards and directly accessible for project managers, and portfolio managers, as well.
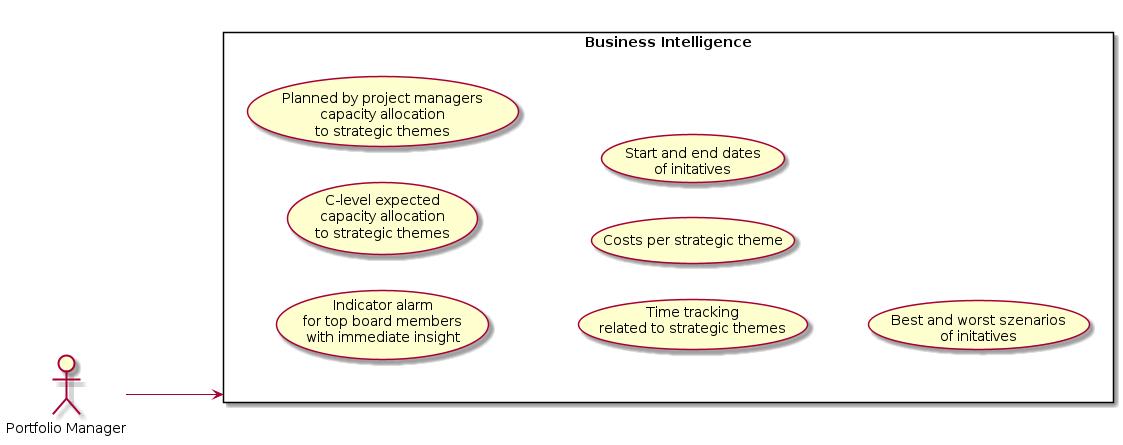
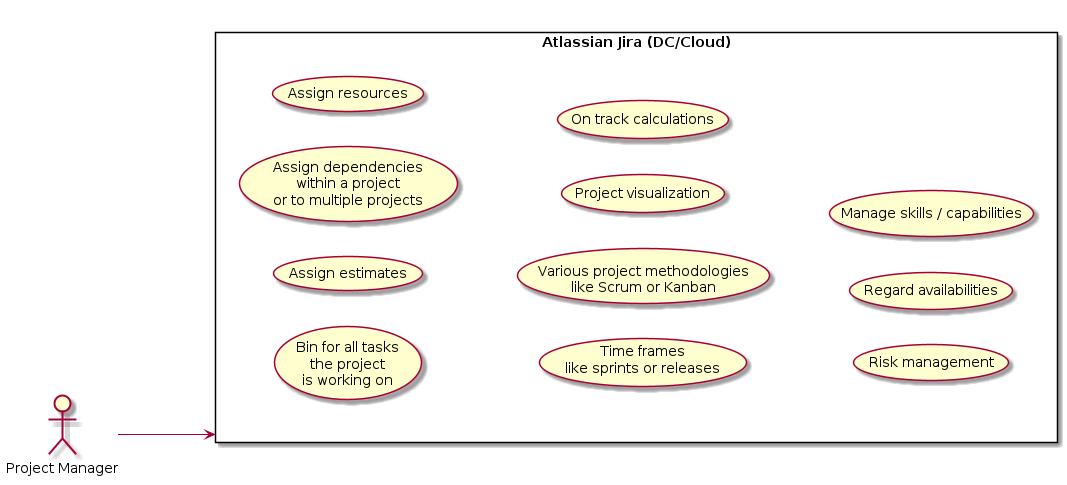
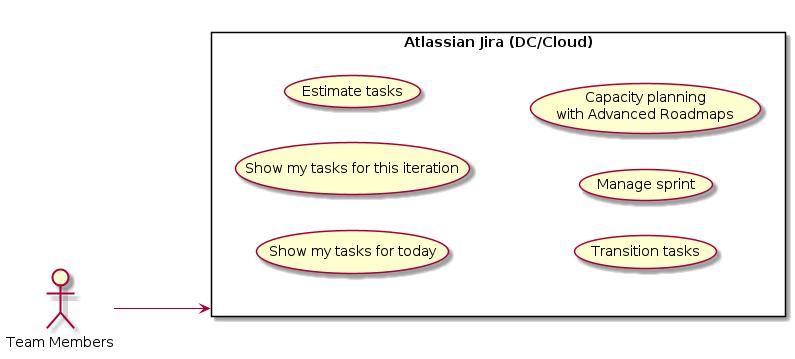
Use Cases
No project details for portfolio managers. Business intelligence tools provide information from real Jira project data accumulated, and aggregated to dashboards.
A selection of popular business intelligence tools: eazyBI (runs on Jira directly), PowerBI (Microsoft Azure), Tableau (Salesforce), Jupyter Notebooks (powerful open source solution for scientist)
Roadmaps, capacity overviews, views with an individual prioritization, sandbox planning / scenarios, risk notification. Project manager usually don’t work with agile boards that are managed by teams themselves. Instead, project managers utilize Jira extensions like Structure and Structure.Gantt.
Getting tasks done is the team’s responsibility. Distinct agile boards present them their actual ongoing tasks, nothing more. Agile boards are not for project managers. That means, agile boards are never overloaded with tasks to do by other teams.
Processes
Opportunity issues are vehicles representing a cluster of activities to generate value. Each cluster is assigned with values describing its effort, and benefit for an organization. These two values strongly influence the rank of an opportunity within a pool of opportunities.
| Effort / Benefit | Strong | moderate |
| Strong | risky | low rank |
| moderate | high rank | medium rank |
In this document, an opportunity comes from the outside of an organization through sales, or through the support team. It also can have its source from the inside of an organization like product development.
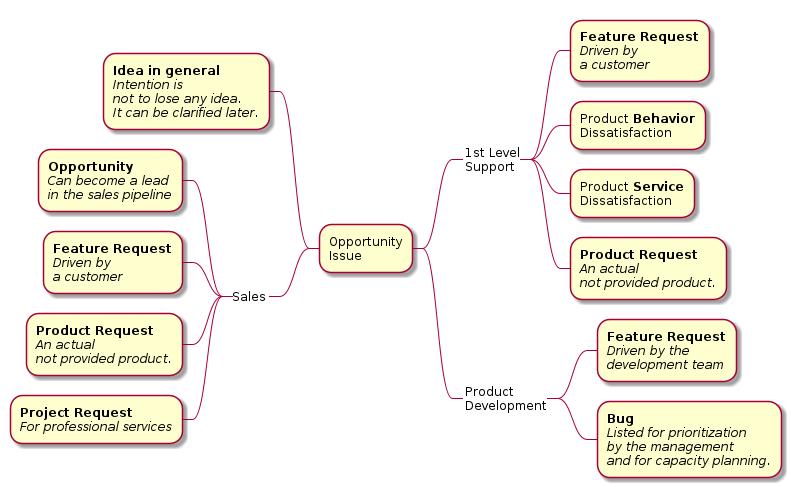
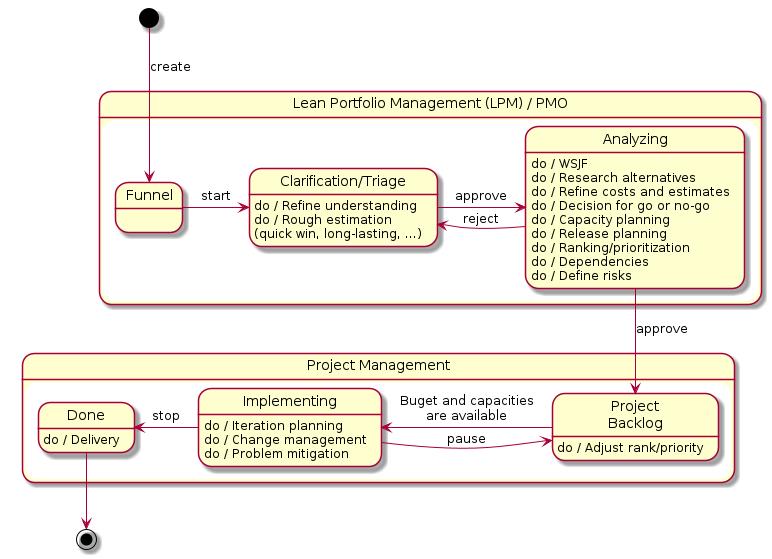
An opportunity issue first flows through the assessment process of the portfolio management, or PMO. As a result, the opportunity appears with its rank in a list with all other opportunities. The organization can focus on what pushes the organization forward to where it want to be in the future.
When assigning strategic themes to an opportunity, the transformation of an organization becomes manageable. For example, if an organization produces a steady revenue with the same products over the last couple of years, a new strategic goal will be an investment with a hypothetical return of investment in the future. Employees usually stick to a steady flow of revenue, and lower rank tasks assigned to strategic goals with a hypothetical revenue in the future.
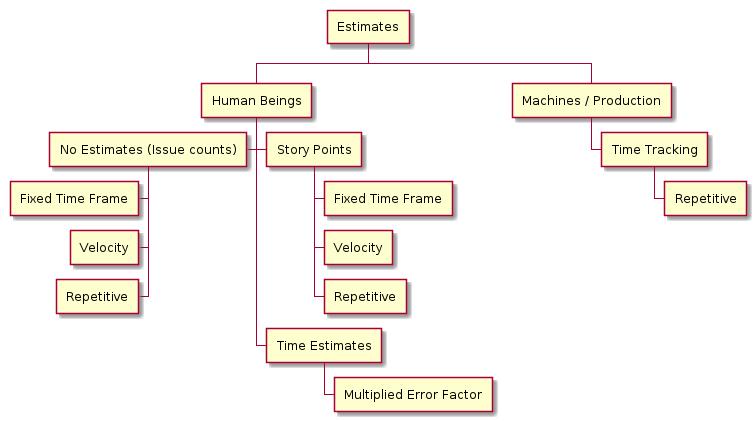
Estimates
This chapter is structured into
Estimates always have a link to historic data, experience.
If historic data is provided, and, if a steady throughput of tasks appears in those dataset, forecasts are always feasible, independent of the kind of estimates like time, story points, or issue counts.
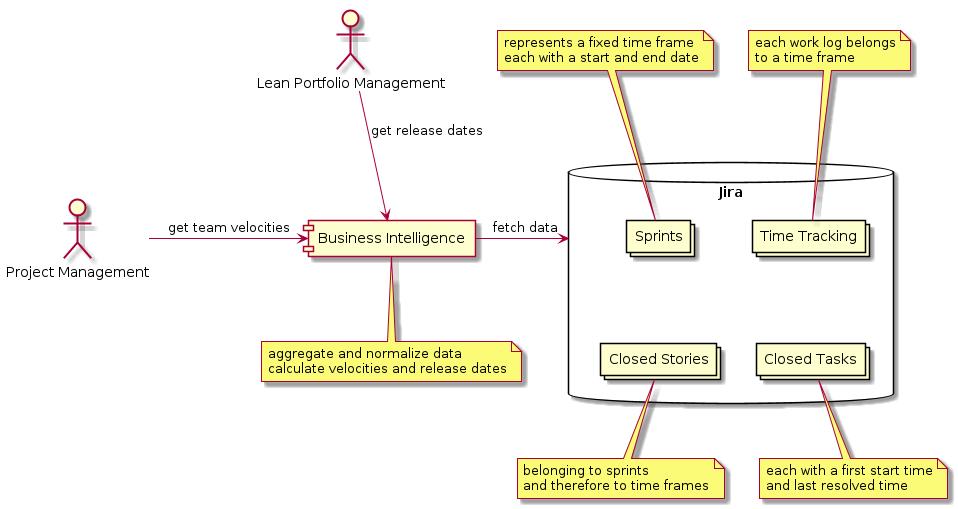
Estimates are drawn from datasets of different kinds. Data get normalized and applied to abstract goals like initiatives. Release dates for initiatives regard available capacities, and calculated velocities.
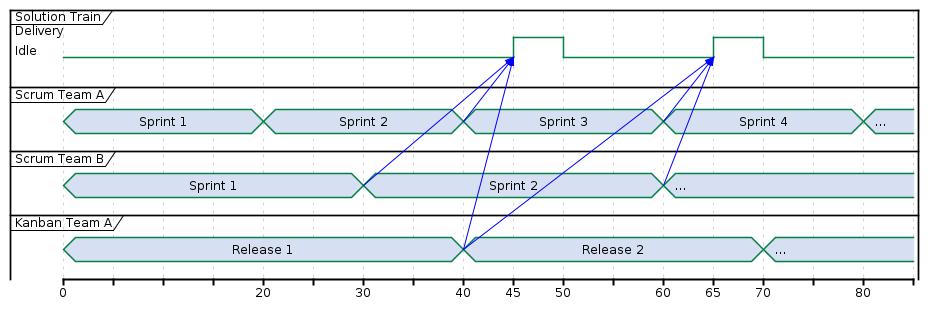
A solution train combines all team results. A team choose its own methodology, and its own cadence. Multi project management means to calculate release dates on higher level, independent of iteration utilized on a team level.
Story Points Only
Story points produce reliable predictions for release dates only if the conversion from story points to time is done on historic data.
Example
For example, if a team’s velocity was 20 story points for a sprint each over the last three months on average, it is very likely to see this team performing with the same amount of story points for the next upcoming sprint.
Velocity
Story points must be assigned to a resource that was existing in the near past, and will be available in the near future. Also, story points must be related to a fixed time frame. Only then story points can be converted to hours.
An example. Three team members are working full-time as a Scrum team. The team capacity is 3x40=120 hours a week. They use story points for all estimates on stories. It appears that this team manages to finish stories with an amount of 32 story points each sprint on average. For this team 32 story points are equal to 120 hours, and that means 1 story point is equal to 3.75 hours.
If a story with, for example, 16 story points still is in progress at the end of a sprint, no story points are counted to the team’s velocity. All 16 story points go to the sprint where this story gets done.
Resources
Does not necessarily have a link to a person.
An abstract description of a resource can be a JQL (Jira Query Language) filter around custom field values like product types, systems, labels, components, or other identifiers.
A time frame on a multi project management level, or, portfolio management level applies its own time frames to work packages. A time frame, for example, can be a program increment.
All participating teams can follow different methodologies, and sprint durations can vary from team to team. All of them will be represented on a portfolio level as an abstract resource, for example, described with a JQL filter.
Time Tracking Only
Time estimates towards story points benefit from being immediately rendered in calendars, timelines, etc. No conversion to time is needed.
A rule of thumbs for an experienced project manager is to multiply all estimates by three. As a result, a big enough buffer will ensure keeping all deadlines. For a more precise buffer, this document present a more sophisticated approach.
Time estimates multiplied with an individual error factor results in pretty accurate forecasts. Usually factors vary within a narrow range if taken into account the same abstract group of resources, fixed time frames, historic data of the last three or six months.
For a more precise project calculation a project manager needs to know the error factors of all involved abstract resources, or rather abstract groups of resources.
Example
Multiple groups of people with a certain fluctuation of team members are working on multiple system components like a specific control unit for airbags, and other systems. Product, and project managers populate all tasks with estimates. Managers also define milestones and release dates. The project has dependencies to other system units, teams.
This project suffers from a bad quality of accurate release dates.
A solution might be to group tasks by actual, or, abstract resources, system components, products, or other identifiers. To gauge how much estimates a group managed to finish within a month over the last three or six months. This might be a reasonable example for a proper reporting. The calculated, individual error factor gets applied to further release date calculations.
No Estimates
Velocities have a direct link to issue counts within a fixed time frame like months. It is worth to check if the throughput of issues per months remains almost the same for thee or six months. If so, this monthly throughput can be converted to time estimates for an issue each.
Example
The issue throughput for system component A is 18 three months ago, 20 two months ago, and 17 one month ago. A common time estimate would be 5x8x4=160 divided by (18+20+17)/3=18.33 results in 8.73 hours per issue. It doesn’t matter how many team members are working on system component A. 8.73 hours per issue for the next upcoming months will provide a project manager with quite accurate estimates.
Blended
All cases above present a method to convert datasets of different kinds to a normalized time estimates. Taking into account team velocities for accurate forecasts.
The next step is to regard dependencies between system component deliveries, particular tasks, project changes, and so on.
Reach out to me for professional support!