Reporting with Jira and Business Intelligence
The calculation is done with Python Pandas regarding normal distribution, exponential distribution in teams, and so on. The results of that calculation are presented with eazyBI.
The screenshots beneath presents you an overview of thousands of issues of multiple teams over two years. These four reports are just an example. Reach out for recommendations, and professional support.
Table of contents
- Who Is Over-Allocated Within A Time Range?
- Who Is Over-Allocated In General?
- Enough Capacity Regarding Estimates?
- Over-Allocation And Duration
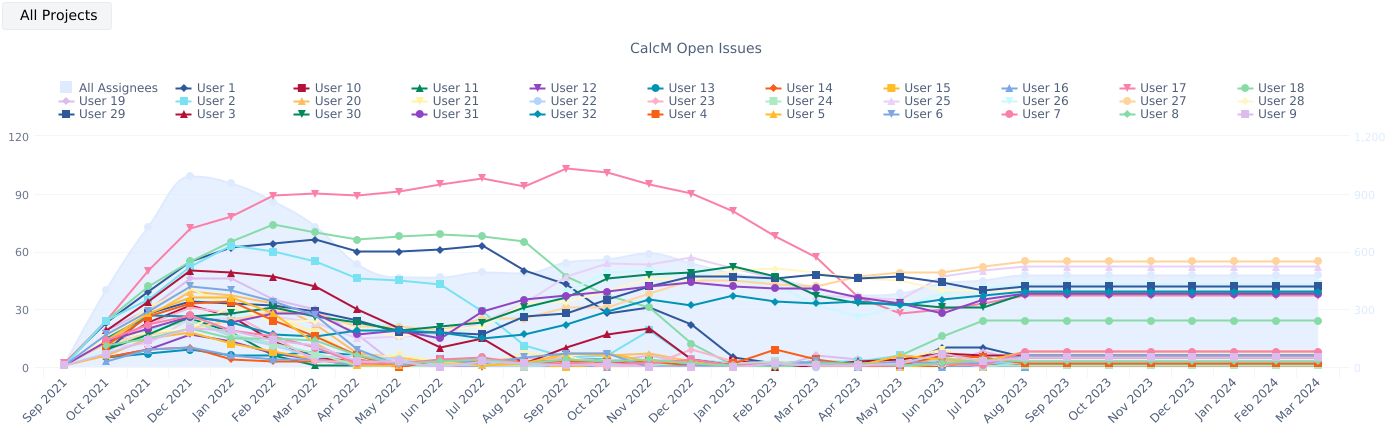
Who Is Over-Allocated Within A Time Range?
Each line represents a person. The higher, and longer a line appears the more this person seems to be over-allocated with work.
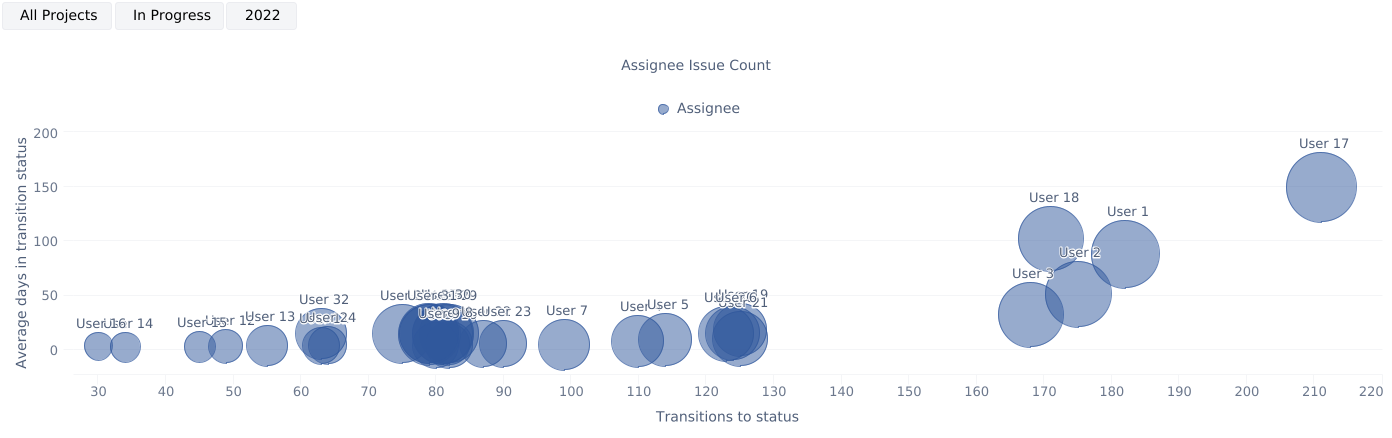
Who Is Over-Allocated In General?
Each bubble stands for a person. The size of a bubble represents the amount of all work for a person.
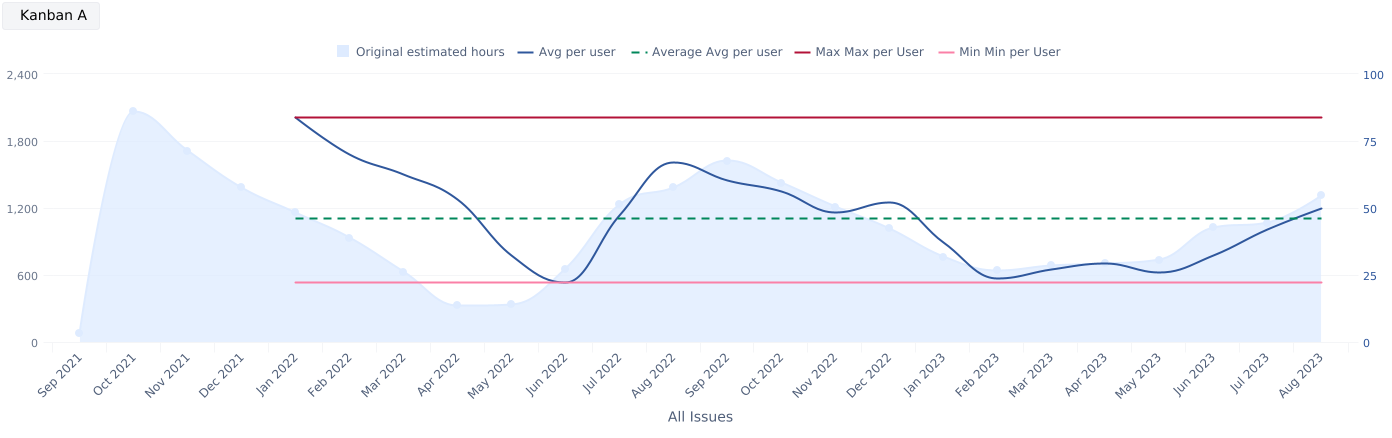
Enough Capacity Regarding Estimates?
Compare estimates with logged worktime over time ranges.
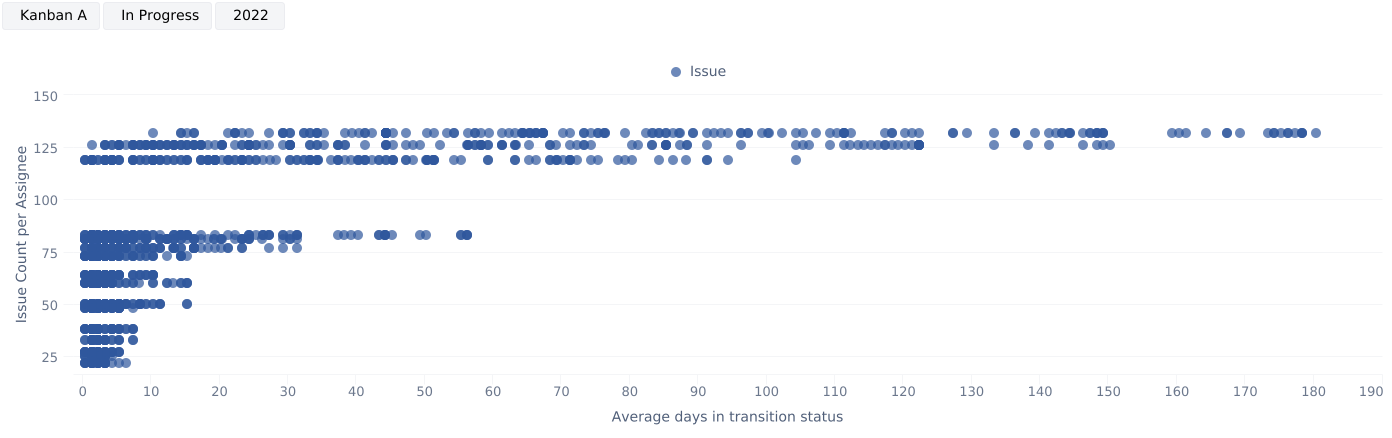
Over-Allocation And Duration
Each point represents a Jira issue. The height represents the amount of all work of an assignee. The position on the x-axis displays the duration.
Reach out to me for professional support!